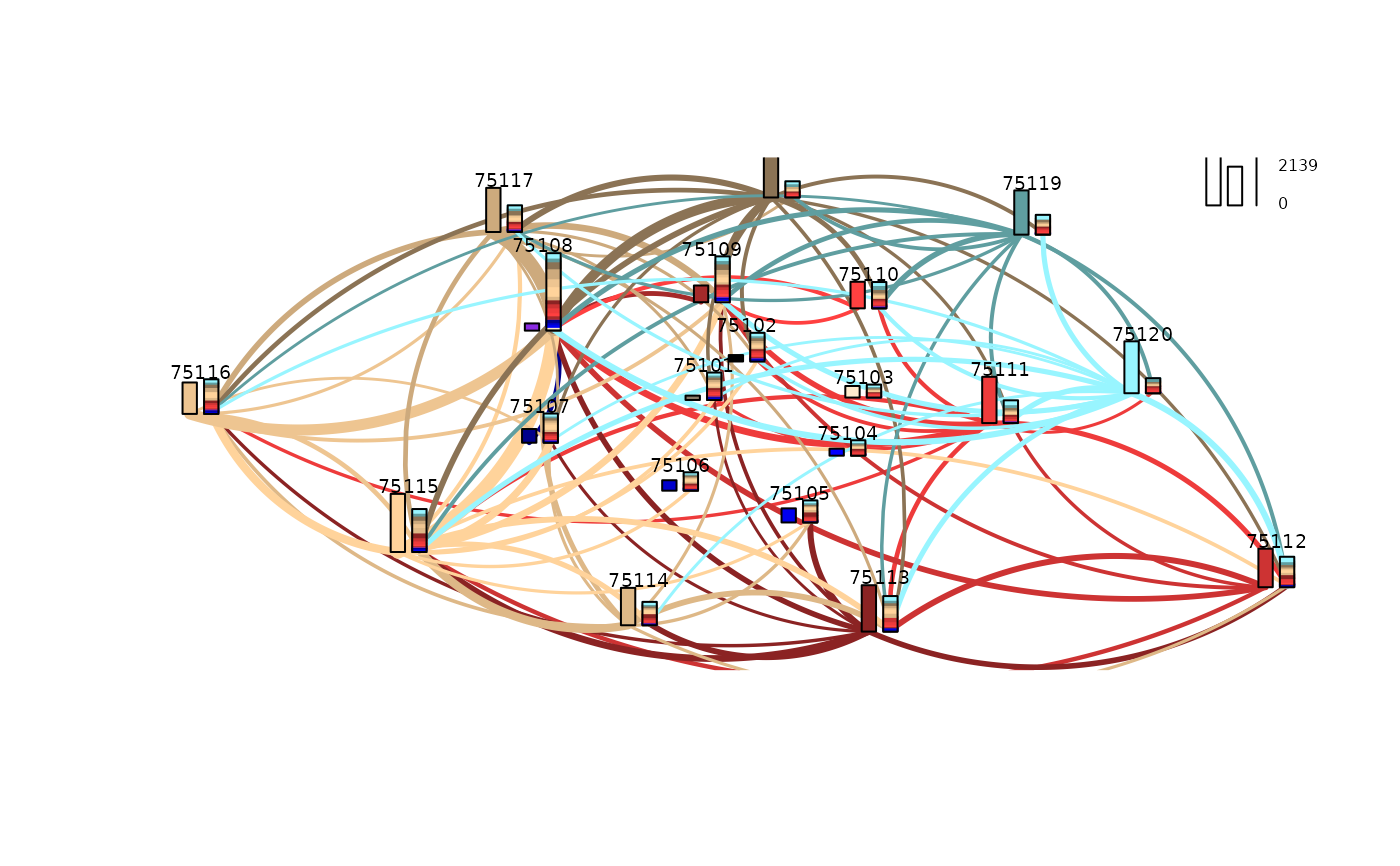
The graphic combines a graphical representation of origin-destination flows with bar charts that represent the total inflow and outflow per site. By default only the largest 25% of flows are shown.
map_flows(
  y,
  index_o,
  index_d,
  coords_s,
  color_palette = sample(colors(), size = nrow(coords_s), replace = nrow(coords_s) >
    length(colors())),
  add = FALSE,
  max_lwd = 1,
  filter_lowest = 0.75,
  max_bar = 1,
  legend_position = "none",
  decimal_points = 0,
  add_labels = FALSE,
  remove_intra = FALSE,
  cex = 0.6,
  na_rm = TRUE
)
Arguments
- y
A numeric vector of flows
- index_o
A factor/character vector of origin ids (should be the same length as y)
- index_d
A factor/character vector of destination ids (should be the same length as y)
- coords_s
A matrix or data.frame, containing coordinates for each (unique) origin and destination in
index_oandindex_d. The rownames musts be given and must correspond with the identifiers of the origins and destinations.- color_palette
A character vector of colors. Should have the same length and ordering as the coordinates in
coords_s- add
A logical, controlling whether a new graphic window may be opened
- max_lwd
A numeric, indicating the value of the maximum width for the lines connecting the origins with the destinations
- filter_lowest
A numeric, that gives the value of the highest quantile to represent (e.g.: if
filter_lowest = .75, only the largest 25% of flows are shown)- max_bar
A numeric, indicating the height of the largest bar-chart shown
- legend_position
A character, indicating the legend position. Should be one of
c("none", "bottomright", "bottom", "bottomleft", "left","topleft", "top", "topright", "right", "center")- decimal_points
A numeric, indicating the number of decimal points shown in in the legend
- add_labels
A logical, controlling whether the site names should be printed
- remove_intra
A logical that sets the intra flow to null values
- cex
A numeric, controlling the font size of the legends
- na_rm
A logical, if
FALSEthe estimation throws an error when the data containsNAvalues. Otherwise the estimation proceeds with a sub-sample.
Value
Creates a graphical representation of origin-destination flows
Examples
library(spflow)
library(sf)
#> Linking to GEOS 3.10.2, GDAL 3.4.1, PROJ 8.2.1; sf_use_s2() is TRUE
data("paris10km_commuteflows")
data("paris10km_municipalities")


# use only the 20 central aggrandisements of Paris
two_letters <- function(x, var) substr(x[[var]], 1 , 2)

paris_arron_commuteflows <- paris10km_commuteflows[
  two_letters(paris10km_commuteflows, "ID_DEST") == "75" &
    two_letters(paris10km_commuteflows, "ID_ORIG") == "75",]

paris_aggrandisements <- paris10km_municipalities[
  two_letters(paris10km_municipalities, "ID_MUN") == "75" ,]

# create the matrix with the coordinates
coords_xy <- st_coordinates(st_centroid(paris_aggrandisements))
#> Warning: st_centroid assumes attributes are constant over geometries
rownames(coords_xy) <- paris_aggrandisements[["ID_MUN"]]

map_flows(paris_arron_commuteflows[, "COMMUTE_FLOW"],
          paris_arron_commuteflows[, "ID_ORIG"],
          paris_arron_commuteflows[, "ID_DEST"],
          coords_s = coords_xy,
          legend_position = "topright",
          color_palette = colors(distinct = TRUE)[20:41],
          add_labels = TRUE,
          remove_intra = TRUE)