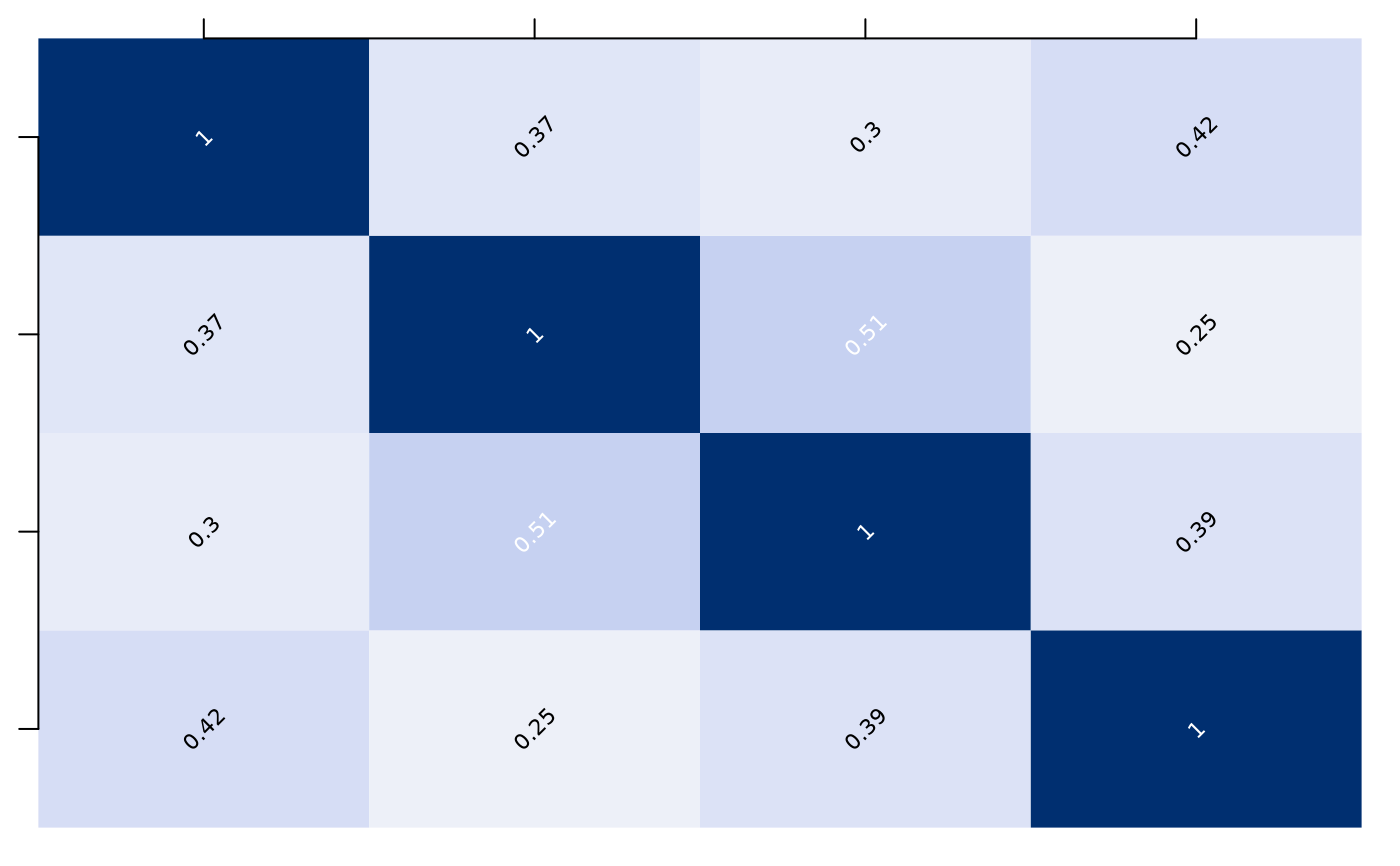
The function shows an image() of a correlation matrix, where row-and column names
are use as labels.
cor_image(cor_mat, cex = 0.7, srt = 45, cex.axis = 0.7)Arguments
- cor_mat
A matrix of pairwise correlations
- cex, cex.axis
Numerics indicating the font size for text- and axis labels
- srt
A numeric controlling the angle of the text
Value
A graphical representation of the correlation matrix